Continual Monitoring Of Nitrogen Oxides & Visibility Inside Tunnels
Published 08 Feb 2020
A Whitepaper by SICK AG
Author: Christian Kuhn – Product Manager at SICK AG in Waldkirch, Germany
Introduction
Gas Detection in Tunnels
It is essential to monitor air quality and visibility in tunnels to ensure road safety. Measuring the visual range and CO concentration has therefore been part of standard practice for many years now.
In the current discussion surrounding exhaust gases emitted by diesel vehicles, the health risk posed by nitrogen oxides, nitrogen monoxide (NO), and nitrogen dioxide (NO2) plays a central role. These harmful gases present a considerable risk to the public. The European Environment Agency estimates that a total of 10,400 deaths were caused by nitrogen oxides in Germany alone in 2012. The total figure for Europe was an astonishing 75,0001¹.
The restricted airflow in a tunnel often means that the concentrations of gases are higher inside than outside. To reduce the harm to tunnel users’ health, the air must therefore be thinned or exchanged with the aid of jet fans, for example.
However, tunnel ventilation is extremely energy-intensive and expensive and must therefore be controlled according to demand. Measuring instruments provide the necessary data for this process. The ratio of NO2 to NO is not stable in tunnel systems. It can vary between 10:1 and 4:1. This is why it is important to measure both concentrations accurately.
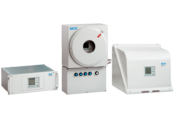
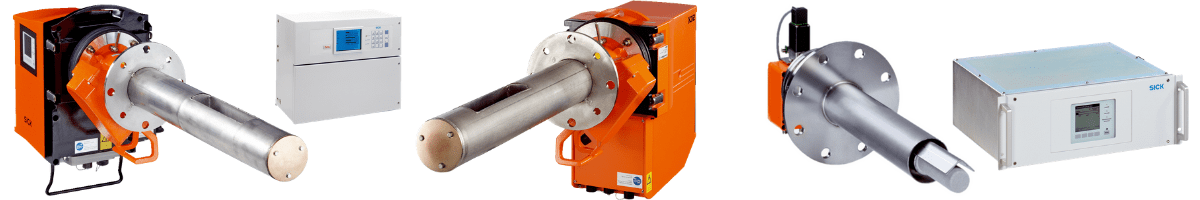
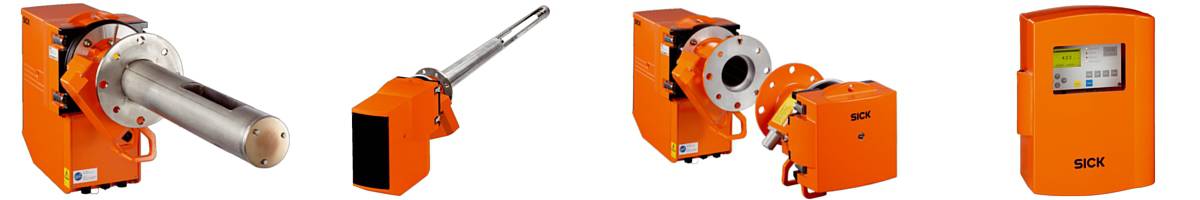
When taking measurements in tunnel atmospheres in the ppb range, the measuring instruments need to meet the highest demands. They must be able to measure very low pollutant concentrations and must not require high levels of maintenance. This report demonstrates the measurement accuracy of the VICOTEC320 air quality tunnel sensor.
Long-term Stability
Tunnel availability needs to be maximized as far as possible. If a tunnel requires maintenance, then part or all of the tunnel must be closed. This must be avoided wherever possible. Measuring instruments in tunnels must therefore demonstrate exceptionally good long-term stability. Maintenance is often only performed once a year. The measurement accuracy may only exhibit a negligible change over this time.
Cross Sensitivity to Humidity and Dust
Tyre and brake wear as well as exhaust gas particles lead to an increased concentration of dust, and measuring instruments in tunnels must be able to cope with these conditions. Changing dust concentrations must not affect the measured values. In many tunnels, the relative humidity is also high. The humidity in the measuring gas often interferes with measuring instruments and can lead to anomalous measurement results. Cross sensitivity to air humidity cannot therefore be tolerated.
Accuracy
Protecting the health of users and ensuring the efficiency of the tunnel are equally important. The measuring instruments must supply data which is as accurate as possible for the tunnel ventilation to ensure that the limit values are not exceeded and, on the other hand, that energy is not consumed unnecessarily by ventilating a tunnel too frequently or for too long.
DOAS Measurement principle for measuring NO and NO2 in tunnels
Gas molecules are excited by electromagnetic radiation. This excitation occurs at wavelengths which are typical for the gas in question. If electromagnetic radiation of a certain wavelength encounters a suitable molecule, the radiation excites the molecule and at the same time loses energy. The molecule absorbs energy. The more molecules of a certain gas there are, the more the radiation is absorbed in this area.
With differential optical absorption spectroscopy (DOAS), light is emitted from a sender or a lamp, travels through a measuring distance, and then encounters a receiver. The receiver splits the light into a spectrum. This enables you to detect how much energy is absorbed at which wavelength by the gases that are present.
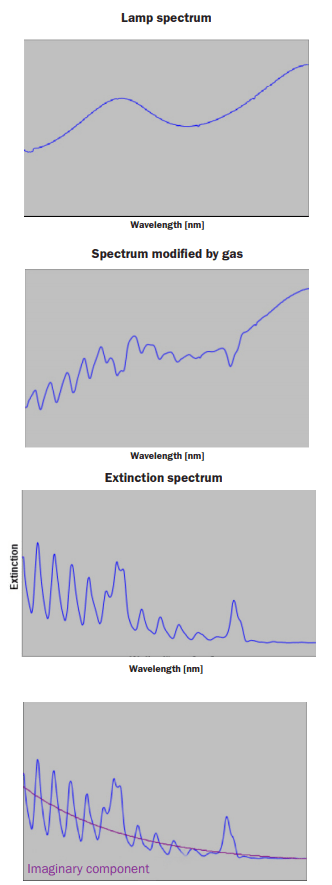
The light source emits electromagnetic waves in a certain spectrum. This spectrum is absorbed by the receiver. To obtain the spectrum of the lamp, the light is sent directly to the receiver without traveling through the measuring distance. This is repeated at specified intervals during operation of the measuring instrument. This means that the measuring instrument always attains a reliable zero point.
- This excludes the possibility of zero point drift for the measuring instrument.
If the electromagnetic radiation hits target molecules when traveling through the measuring distance, radiation is absorbed. This means that there is a lower signal at certain wavelengths.
The receiver then absorbs a modified spectrum. The degree of absorption of a molecule changes as little as the wavelength at which it is absorbed. The resulting measuring range drift, which is practically non-existent, is important for ensuring that measurements in the tunnel will remain
stable in the long term.
If you divide the modified spectrum by the spectrum of the lamp and plot it logarithmically, you get a spectrum which shows the weakening of the
output signal – otherwise known as extinction.
Extinction is not just caused by gas molecules. Fog droplets and dust can also result in extinction. This extinction, however, takes place across the whole spectrum rather than specifically at certain wavelengths. This impact over the entire spectrum can be represented by an imaginary component. This is crucial for application in a tunnel. The measurement result is therefore not affected by dust, contamination, or water droplets.

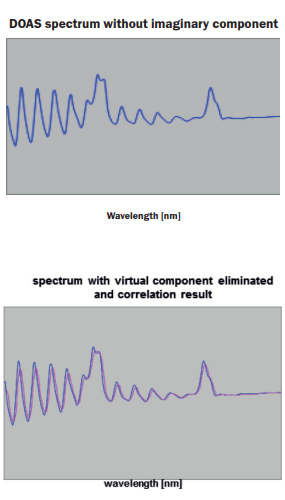
This means that the measurement principle is not affected by dust or dirt. Mechanical filters, as used in other measurement procedures, are therefore not required in this case.
Mechanical filters result in very long response times in the case of “sticky” gases such as NO2 and must therefore be avoided.
Removing the imaginary component from the extinction curve results in the differential absorption spectrum. It is differential because you analyse the distance between a peak and the subsequent trough rather than the absolute height of the individual peaks.
The calculated DOAS spectrum is compared with the reference spectra stored in the instrument. The associated measured value is displayed in the case of maximum agreement.
| Requirement in tunnel | Spectrometer-based DOAS solution | Evaluation |
| Measurement with long-term stability | Zero point drift excluded due to absorption of the lamp spectrum | ✔ |
| Measured value drift extremely low due to physical laws | ✔ | |
| Not affected by dust, dirt or droplets | Any effect is excluded by a method of calculation. No mechanical filters required. |
✔ |

Sensors – Temperature Measurement Technology from SICK.
Test Description
There are no standardized performance requirements for optical measuring instruments in tunnels. Either the concentrations of harmful gases emitted by vehicles are measured within the tunnel, or the gas emissions which escape from the tunnel into the area surrounding the tunnel portal are measured. To determine the performance data, it therefore makes sense to consult the latest version of the following test specification: EN 15267 “Air quality. Certification of automated measuring systems. Part 3: Performance criteria and test procedures for automated measuring systems for monitoring emissions from stationary sources”. In accordance with this standard, we have defined the following:
Linearity: Systematic deviation within the area of application of the measuring system between the recognized value of a reference material which has been assigned to the measuring system
and the corresponding measurement result supplied by the calibrated measuring system.
Setting time (t 90): Time period between an abrupt change to the value of the input of an automated measuring system (AMS) and the time as of which the value of the output remains reliably above 90% of the correct value of the input.
Repeatability: Capability of a measuring instrument to produce very similar results when supplied with the same measurand under the same measuring conditions
Drift: Monotone change of the calibration function within the specified maintenance interval, leading to a change in the measured value.
Gas Detection limit: Equal to double the repeatability standard deviation at the zero point.
Accuracy: The term “accuracy” does not have an exact definition in the field of measurement technology but is usually understood as a combination of precision and trueness.
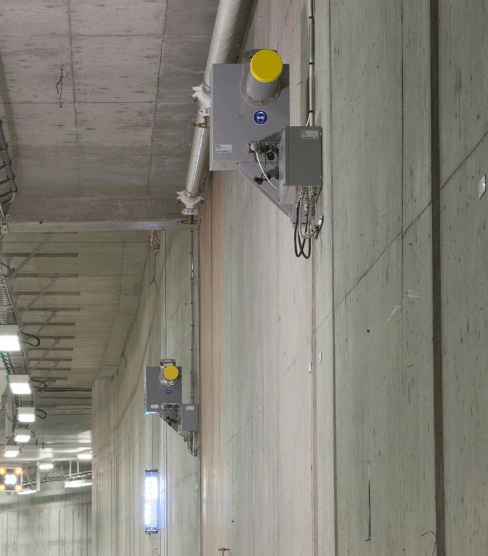
The tests were conducted using a standard VICOTEC320 on a measuring distance of 10 m. The gas concentration measurements were conducted based on cells filled with gas. The gases were generated by a HOVACAL gas generator. Certified gas mixtures were used as basic gases.
Linearity of measuring instruments
To prevent hysteresis effects from affecting the linearity of measuring instruments as much as possible, EN 15267 suggests a specific sequence of measured values. The concentration points should therefore be approached in the following order:
- Zero point
- Approximately 70% of the measuring range limit value
- Approximately 40% of the measuring range limit value
- Zero point
- Approximately 60% of the measuring range limit value
- Approximately 10% of the measuring range limit value
- Approximately 30% of the measuring range limit value
- Approximately 90% of the measuring range limit value
- Zero point
The concentrations were initially produced in a gas-filled cell. As soon as the measured values reached a stable plateau, the values were recorded and the analysis then progressed to the next concentration level.
NO Measurement
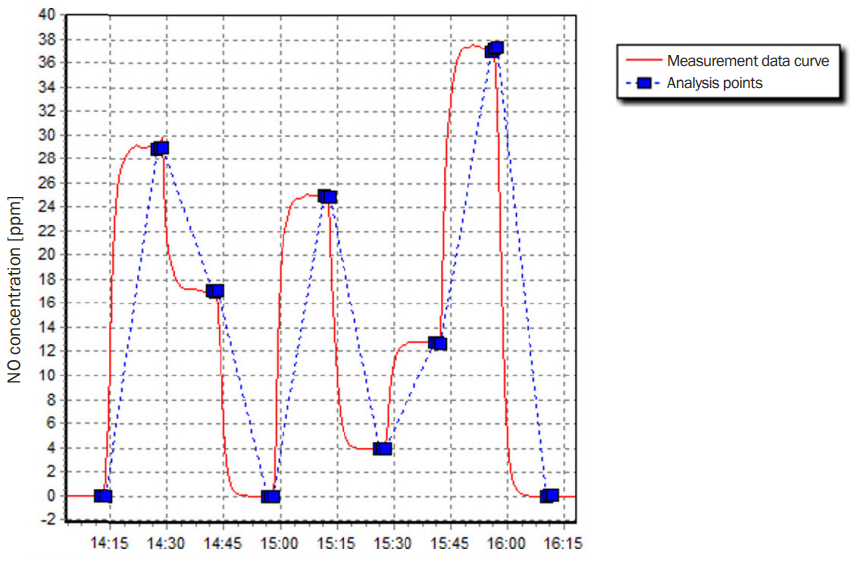
NO Measurement
The analysis of the measured values reveals a linearity error / lack of fit of:
| Absolute deviation | Deviation relative to the measuring range limit value | |
| Maximum | 0.48 ppm | 1.06% |
| Minimum | -0.33 ppm | -0.73% |
NO2 Measurement
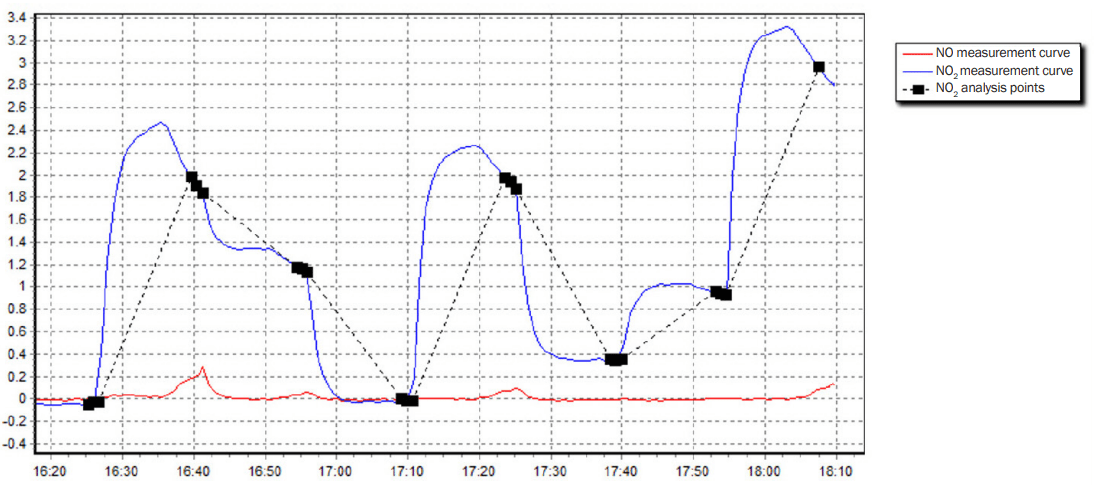
NO2 Measurement
The results for NO2 revealed that the concentrations of NO2 are not stable and degrade quickly. The NO2 measurement was therefore taken in the flow of gas, which meant that the concentrations could no longer be set according to EN 15267-3.
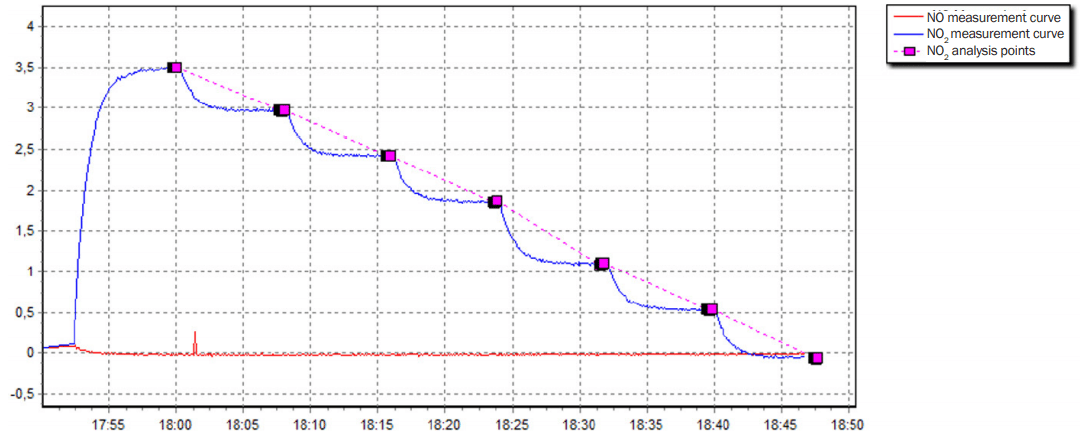
NO2 Measurement
The analysis of the measured values reveals a linearity error / lack of fit of:
| Absolute deviation | Deviation relative to the measuring range limit value | |
| Maximum | 0.017 ppm | 0.335% |
| Minimum | -0.024 ppm | -0.485% |
Gas Detection Limit
Gas measurement (NO/NO2)
Gas measurement following the SICK standard method
To check the gas detection limit, the time filter was selected such that a t90 setting time of approx. 30 seconds was achieved. The measurement data was saved with each measuring cycle (5 seconds). To calculate the standard deviation, a measurement time period of 24 hours was analysed. SICK uses three standard deviations to determine the gas detection limit.
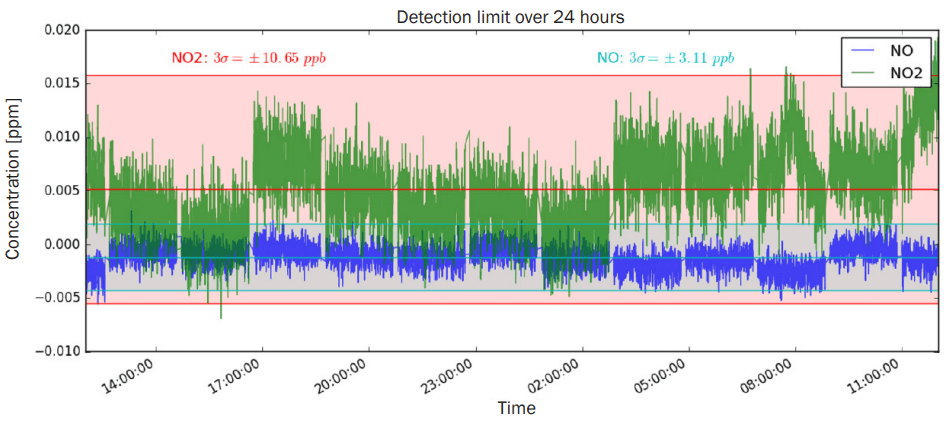
Gas detection limit over 24 hours
| Sigma | Gas Detection Limit* | |
| NO | 0.001 ppm | 0.003 ppm |
| NO2 | 0.0036 ppm | 0.011 ppm |
*3 x sigma in 24 hours
Detection limit in accordance with EN 15267
In contrast to the aforementioned method for determining the detection limit, EN 15267 stipulates that 20 consecutive measured values must be recorded.
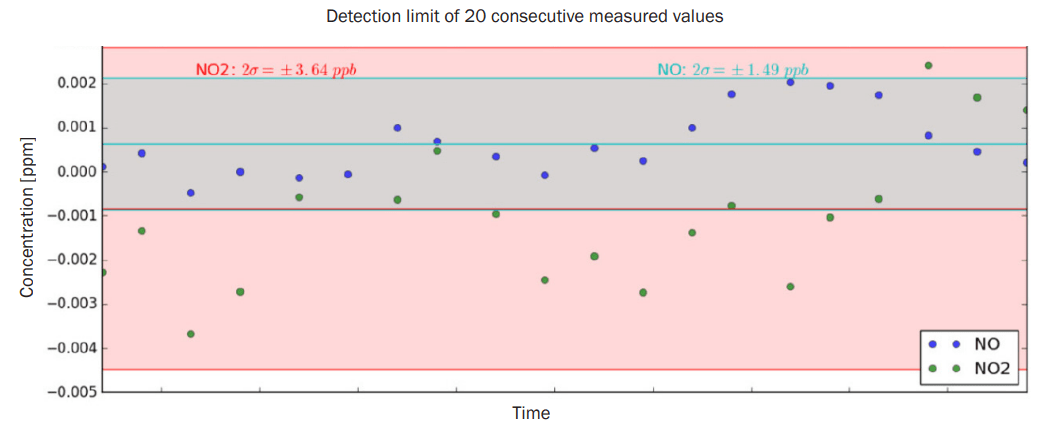
Detection limit of 20 consecutive measured values
| Detection Limit | |
| NO | 0.0015 ppm |
| NO2 | 0.0036 ppm |
Visibility
Visibility in accordance with the SICK standard method
To determine the visibility detection limit, we followed the same method. The measured values with clear visibility are recorded for 24 hours.
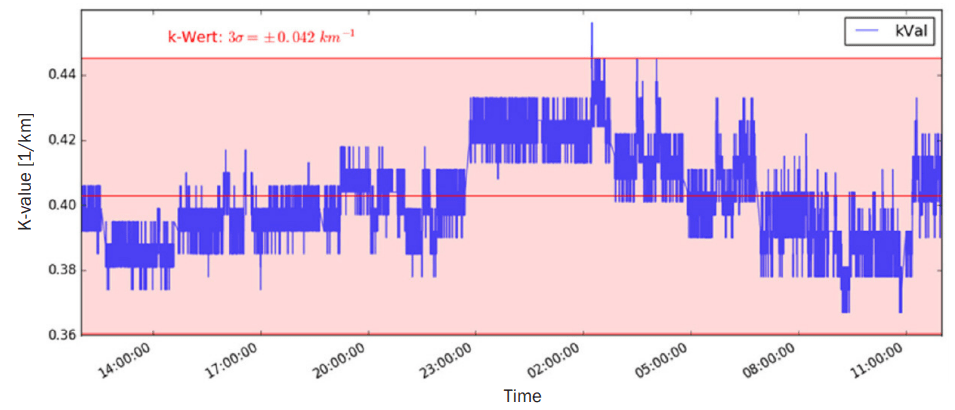
Visibility in accordance with the SICK standard method
| Single Standard Deviation | Triple Standard Deviation | |
| Visibility | 0.014 k | 0.042 k |
Visibility in accordance with EN 15267
Following the above requirements as stipulated by EN 15627 results in a double standard deviation with 20 consecutive measured values of 0.016 k.
Reproducibility / Repeatability standard deviation at the reference point
Gas measurement (NO/NO2)
Due to the instability of NO and NO2, a cell is used which is constantly purged with calibration gas. This ensures that the gas concentrations are stable.
The measurement signals were recorded for 20 consecutive measured values.
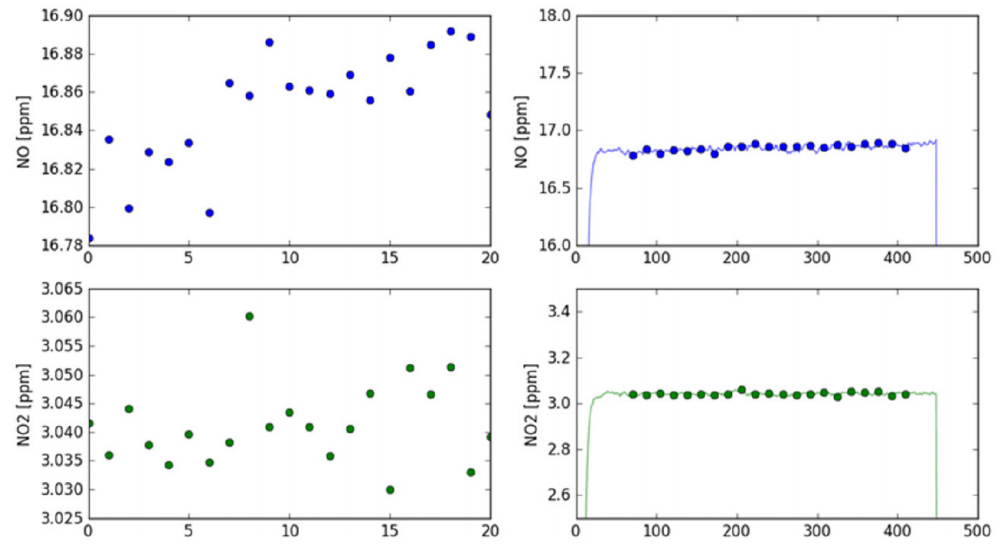 To determine the repeatability standard deviation, EN 15267-3 stipulates that the single standard deviation must be determined. This results in the following standard deviations:
| Unit | NO | NO2 | |
| Measuring range limit value | ppm | 45 | 5 |
| Average value | ppm | 16.85 | 3.04 |
| Standard deviation | ppG | 30.92 | 7.08 |
| Standard deviation relative to the measuring range limit value | % | 0.07 | 0.14 |
| Standard deviation relative to the measured value | % | 0.18 | 0.23 |
Visual Range
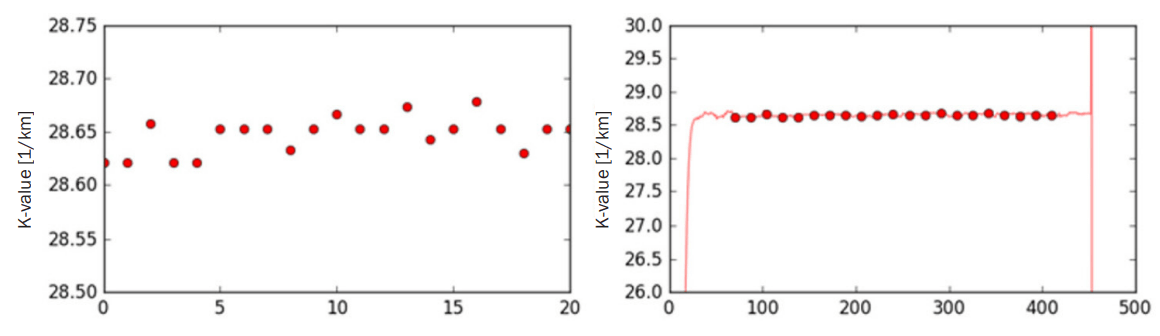
In the same way as the gas measurement, we determined the reproducibility using the standard deviation at the reference point. 20 independent consecutive measured values were taken and the standard deviation was calculated. A reference filter was used to measure the visibility.
Visual Range
| Unit | K-Value | |
| Measuring range limit value | km-¹ | 15 |
| Average value | km-¹ | 28.65 |
| Standard deviation | km-¹ | 0.017 |
| Standard deviation relative to the measuring range limit value | % | 0.11 |
| Standard deviation relative to the measured value | % | 0.06 |
Accuracy
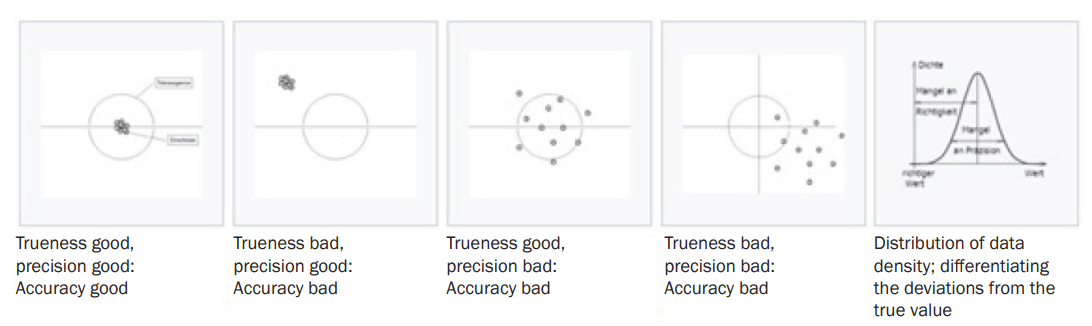
Copyright: Bernhard Thiery – own work, Saure – own work
Measurement results are considered accurate if they are both true and precise. The image of a target with multiple shots is often used by way of illustration.
Determining the measurement trueness
The trueness is influenced by systematic deviations. In the case of the VICOTEC320, these are:
- Linearity error: The linearity error has already been determined (see above).
- Cross sensitivity: When analysing NO2 in the region of 450 nm, no cross influences from gases present in the tunnel have been identified. NO is influenced by NO2 but this is compensated for within the spectrometric analysis.
- Effects of temperature: The effects of temperature are not shown under controlled conditions with a measuring distance of 10 m. They are therefore not included when investigating the measurement trueness.
Determining the precision
All random errors are taken into account when determining the precision. This includes the above-determined factors:
– Repeatability standard deviation
– Zero point drift
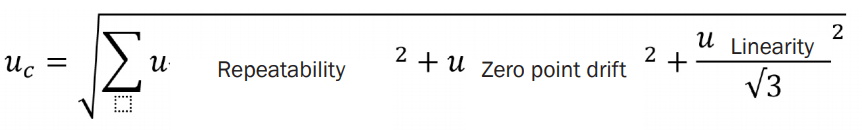
Combined uncertainty as accuracy
The combined uncertainty is always the quadratic sum of the partial uncertainties.
When determining the combined uncertainty, we follow the specifications of DIN EN ISO 14956:2002 based on GUM (“Guide to the expression of uncertainty in measurement”). Statistically distributed uncertainties (normal distribution) are incorporated directly into the total and uniformly distributed uncertainties (rectangular distribution) are multiplied by 1⁄√3.
The accuracy of the VICOTEC320 is therefore
- 0.021 ppm for NO2
- 0.278 ppm for NO
In relation to the measuring range limit value
- 0.42% of 5 ppm for NO2
- 0.62% of 45 ppm for NO
| Partial Uncertainty | Distribution | u p,NO2 | u p,NO |
| Linearity error | Rectangular | 0.0202 ppm | 0.277 ppm |
| Repeatability | Normal | 0.0071 ppm | 0.0309 ppm |
| Zero point drift | Normal | 0.0044 ppm | 0.0014 ppm |
| Accuracy | 0.021 ppm | 0.278 ppm |
Gas, Liquid & Bulk Solids Sensors, Analysers & Detectors from SICK
ELECTRICAL & PROCESS INSTRUMENTATION EQUIPMENT
FOR EXPLOSIVE ATMOSPHERES & Hazardous Areas
Thorne & Derrick are Specialist Distributors of Hazardous Area & Explosion Proof Equipment with IECEx & ATEX Certifications to the onshore and offshore oil, gas, petrochemicals and process industries.
Key Product Categories: Control Panels | Plugs & Sockets | Isolators | Enclosures & Junction Boxes | Lighting | Control Stations | Motor Starters | Heat Trace Cables & Systems | Gas Detection & Detectors | Fire Detection & Detectors | Heat Detectors | Electrical Heating & Heaters
 Also Process Instrumentation Products: Ashcroft Pressure Gauges | ASCO Valves | Katronic Flow Meters | KROHNE Flow Meters | VEGA Level Sensors | Rotronic Temperature & Humidity Sensors | SIKA Pressure Gauges